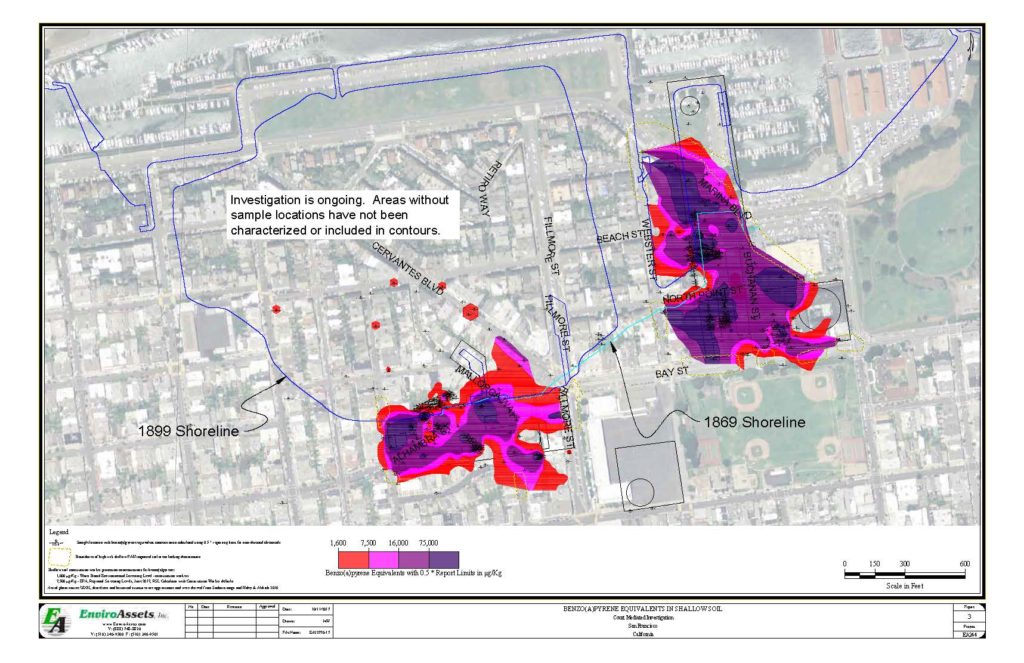
On the MGP Map, each sample represents contamination (e. g. red dot) or lack of contamination (e. g. green dot) at a specific point. Industry practice is to ‘connect the dots’ via contouring to construct area representations commonly known as “heat maps.”
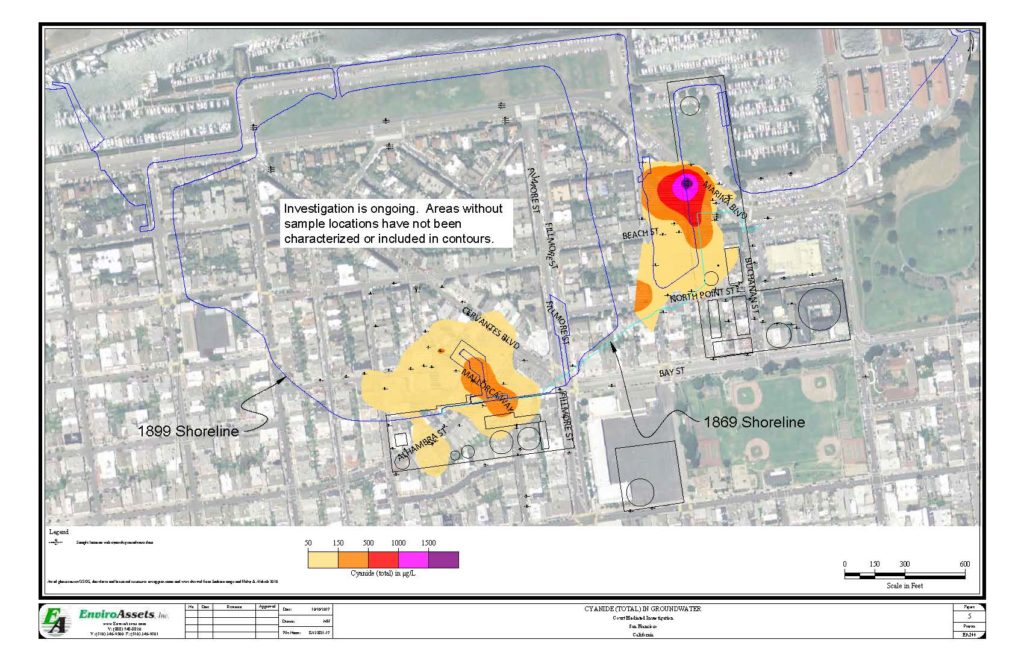
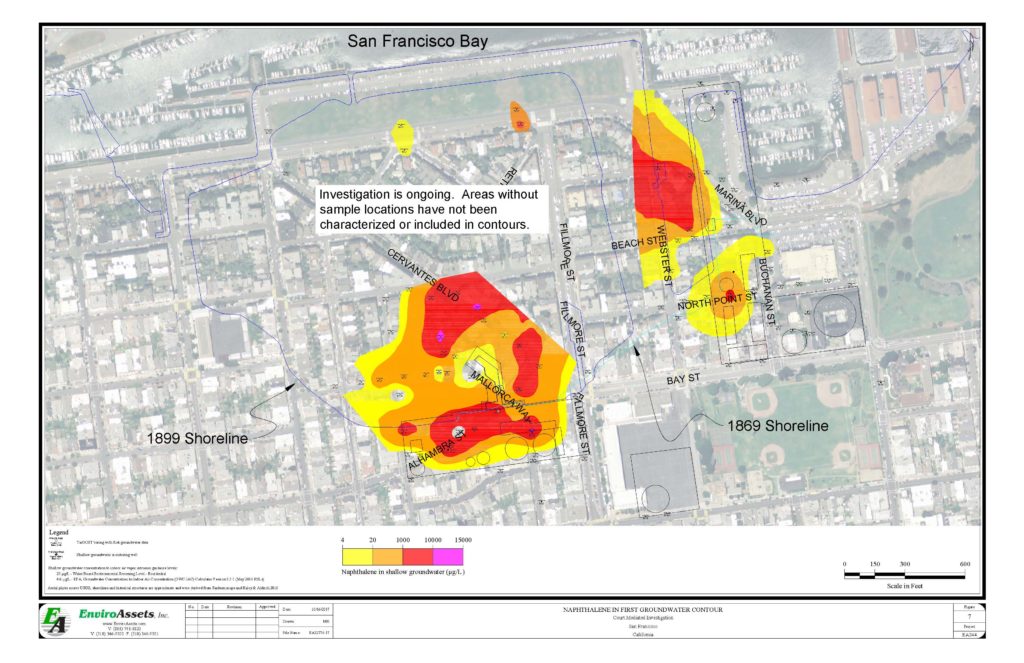
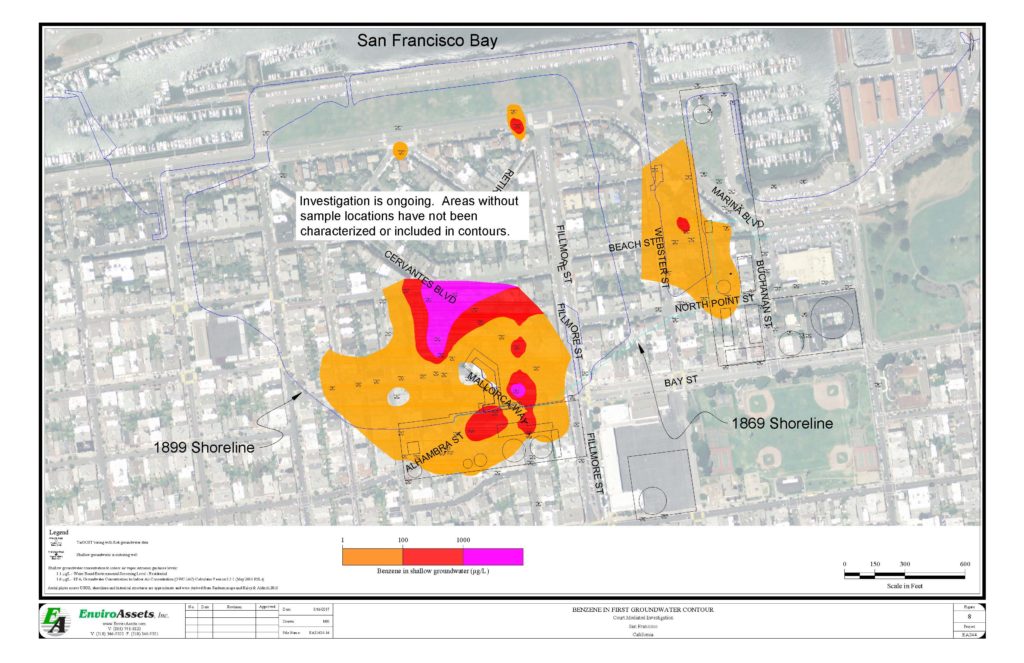
A report delivered to DTSC and the Water Board in October 2017 contained heat maps for the Marina. Below are low resolution images. For higher resolution images, view or download the report itself from the Water Board’s website here. The heat maps can be found on pages 65/550 to 70/550.
Caution: many areas have had little or no investigation which limits the ability to create comprehensive heat maps for the entire Marina. The straight lines seen on some contours hint at where the heat maps were cut off due to limited data.
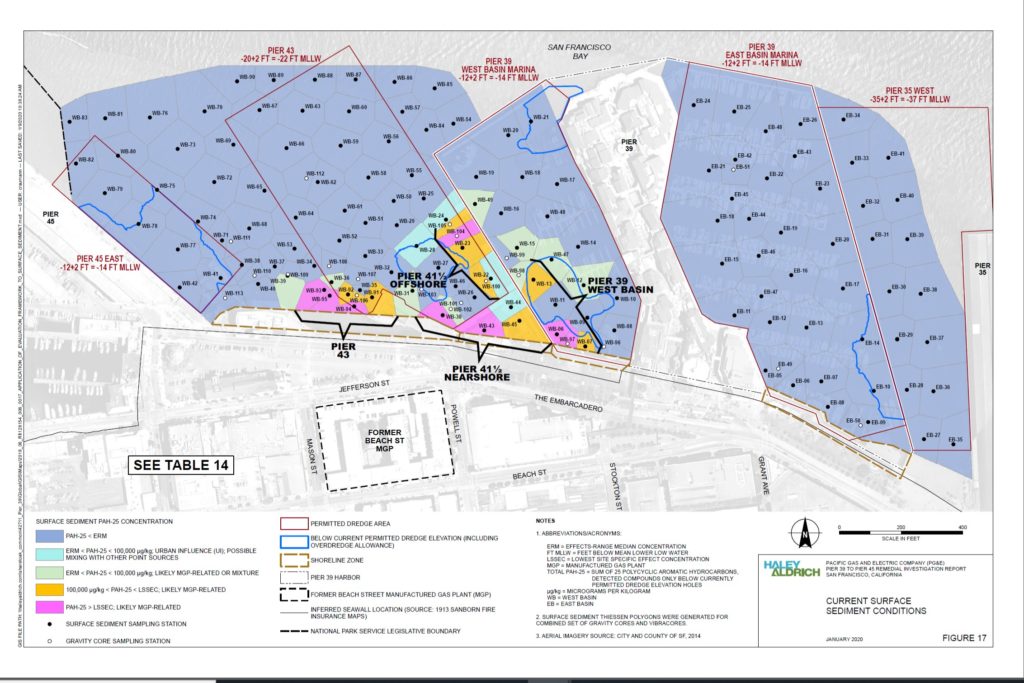
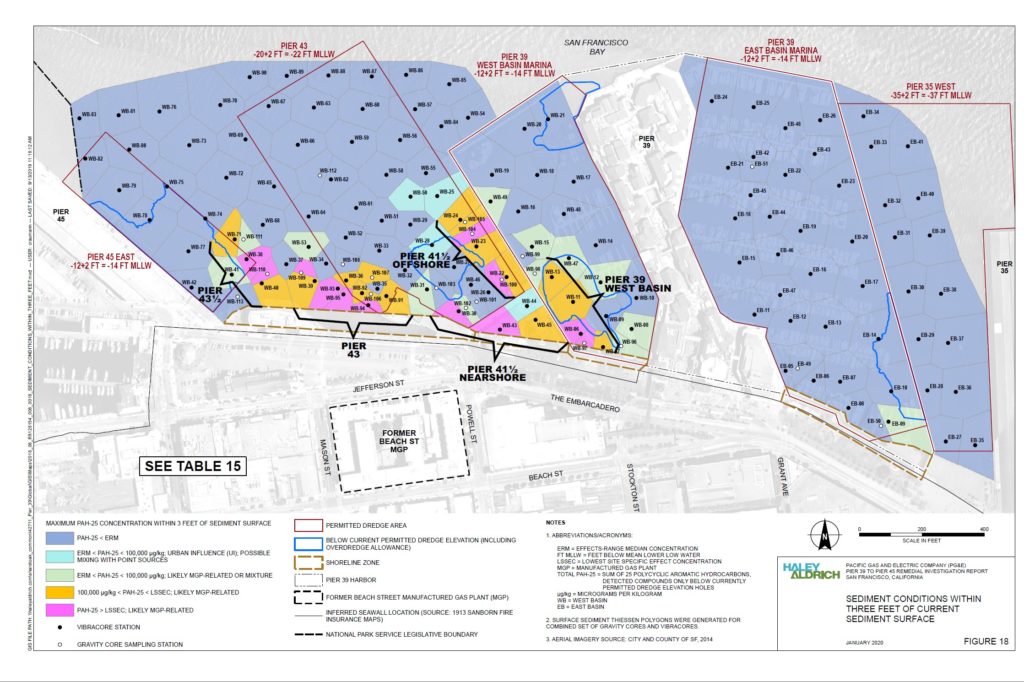
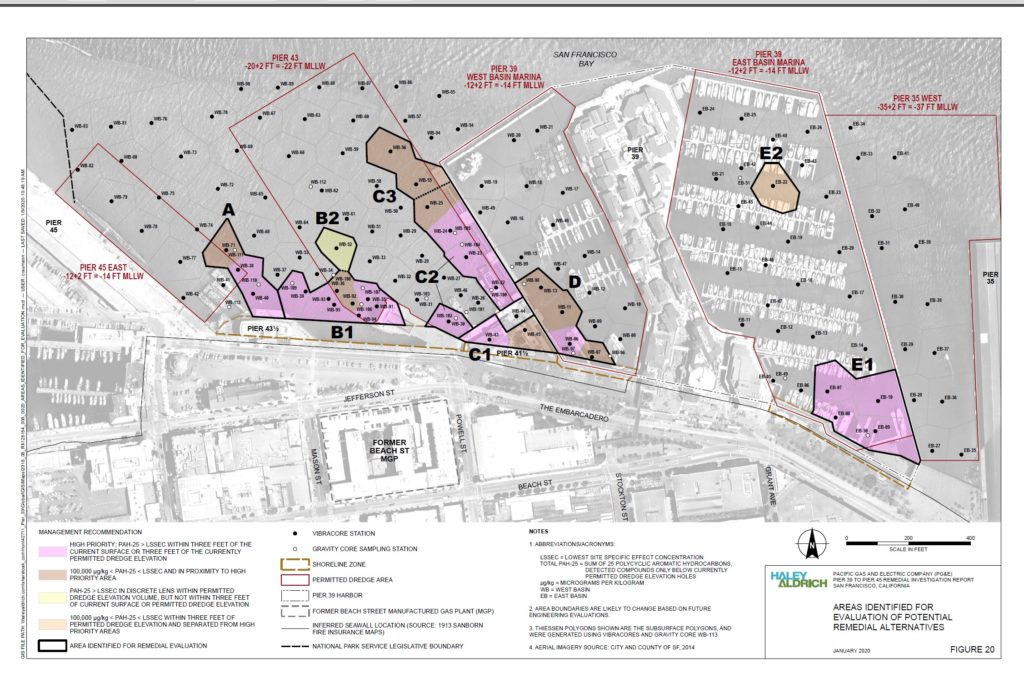
A report delivered to the Water Board in January 2020 contained heat maps for Pier 39 offshore. Below are low resolution images. For higher resolution images, view or download the report itself from the Water Board’s website here. The heat maps can be found on pages 99/855 to 102/855.
Pier 39 PAHs, Current Surface Conditions
Low resolution jpeg. For higher resolution image, view or download the report from Water Board’s website.